Research links increased heat vulnerability to unjust urban planning
Story by Sadie E. Francis
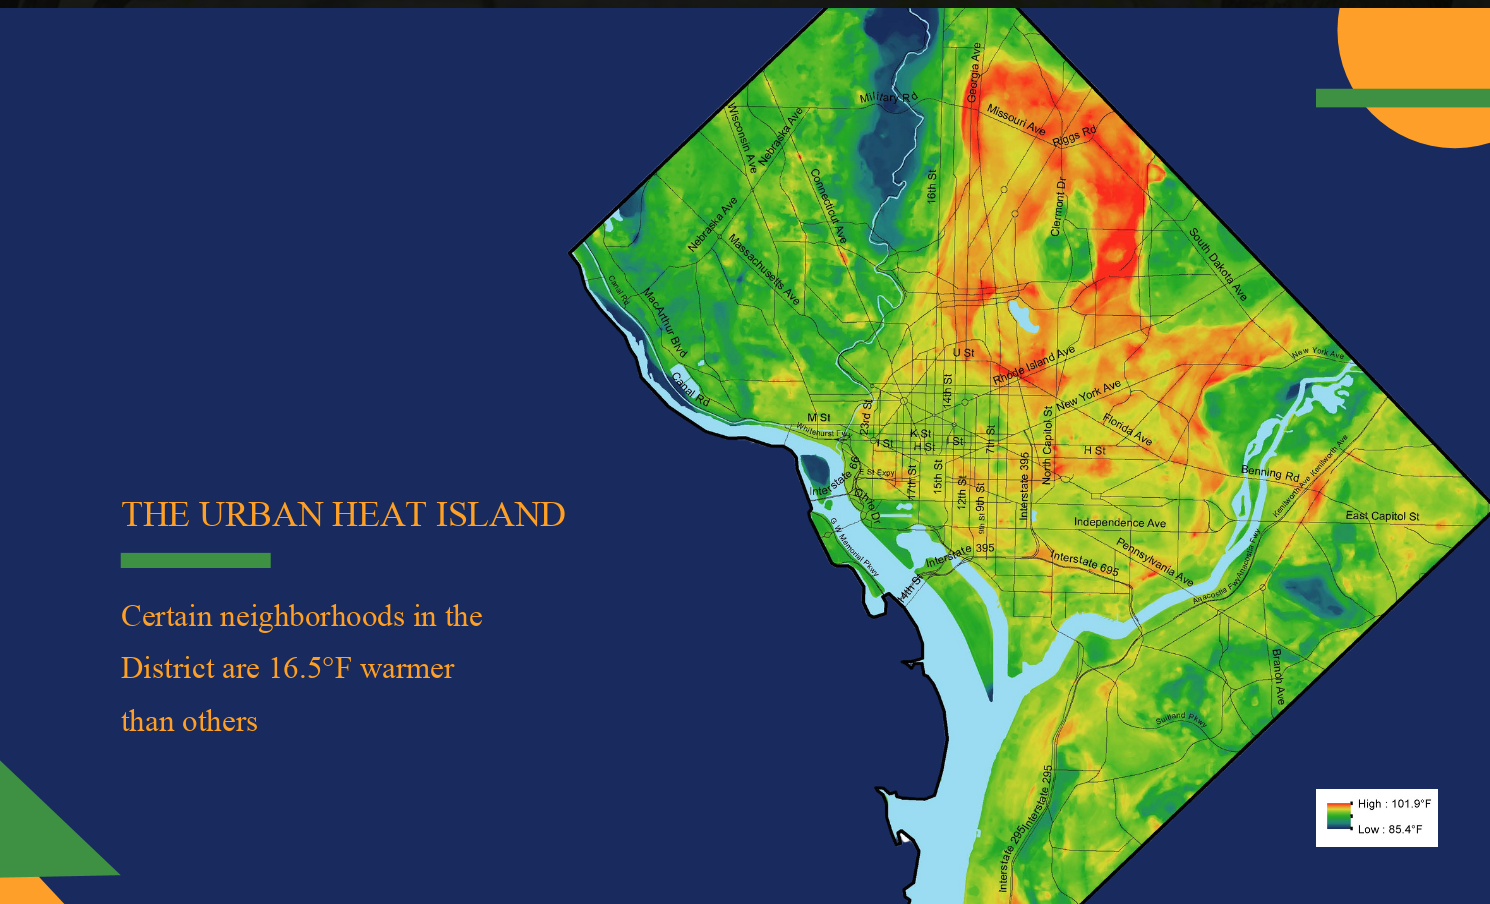
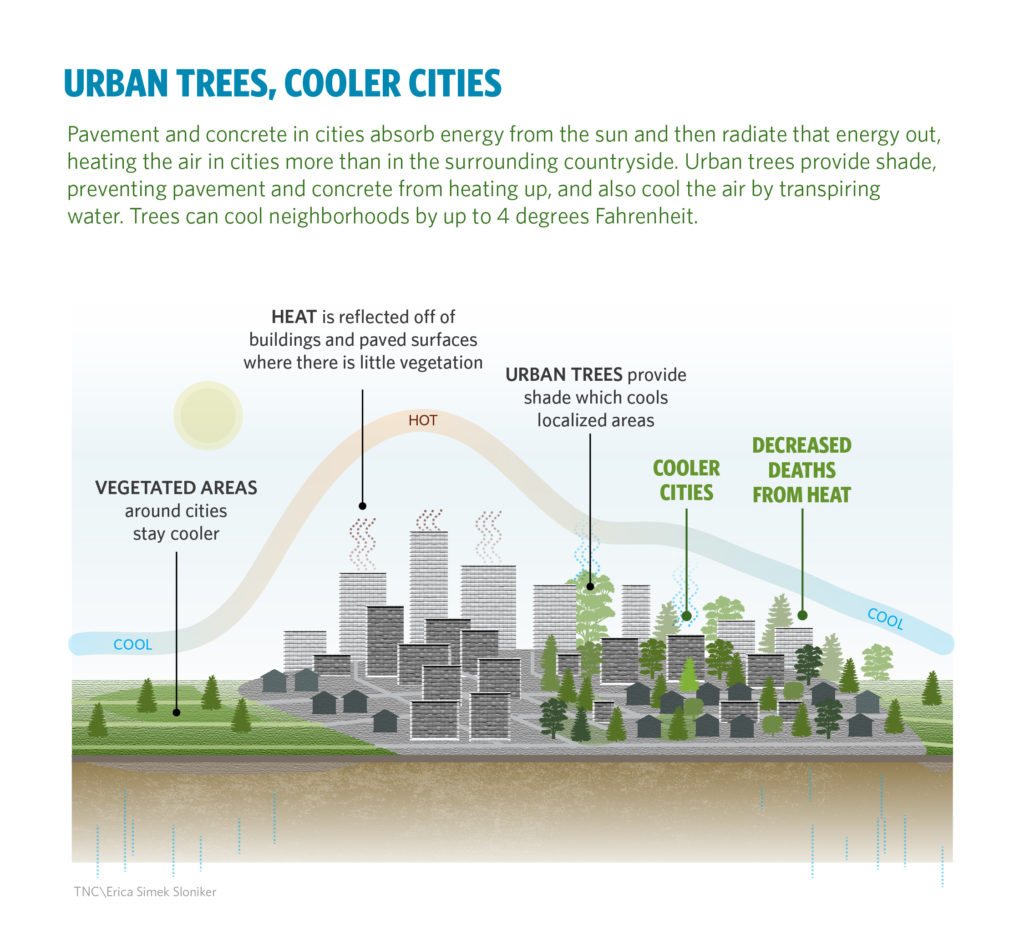
Melting ice caps, rising sea levels, increasingly tenacious hurricanes, and regular flooding have dominated the news cycle around climate change and its effects. But another consequence of our changing climate has been felt for years, particularly in our country’s inner-city neighborhoods, with an annual death toll that exceeds all other weather-related events combined. The urban heat island effect – when land and air temperatures are higher in urban areas due to an abundance of surfaces that absorb and radiate heat – is just starting to get the widespread attention it deserves.
Every decade of the past 50 years has been hotter than the last, and 2020 is already breaking records for not only the severity, but also the duration of its heat waves. As new research sheds light on the scope, increasing intensity, and nature of heat islands, historic inequities are being newly scrutinized, highlighting the integral importance of environmental justice in cities’ climate change adaptation strategies.
Because of land use practices that exacerbate the urban heat island effect, urban areas heat up at roughly twice the rate of non-urban areas. But there is still a large degree of variability among cities, and among neighborhoods within each city. Up until now, public health officials concern for the most vulnerable centered on elderly populations without access to air conditioning. But these new analyses widen our scope of understanding by exploring the relationship between historic urban planning practices and how different urban neighborhoods experience extreme heat, further revealing how the past is continually delivering us to the present.
Why are some city neighborhoods hotter than others?
Redlining – the historical racist practice of refusing home loans or insurance to applicants of color – was largely successful in segregating entire neighborhoods, keeping the neighborhoods dominated by white, above average income households “safe” and “valuable”, while restricting Black and Brown home ownership to “redlined” areas. Although redlining was banned under the Fair Housing Act of 1968, its legacy of entrenched segregation has persisted by way of inequitable distributions of economic opportunities, public services and amenities. A study recently published by the journal Climate analyzed temperature variations across 108 urban areas to see if there were any significant modern implications of these historic housing practices. There were, and they were astounding: the researchers found that land surface temperatures in redlined areas are approximately 4.7°F warmer than non-redlined neighborhoods during the summer. And as these average temperatures continue to rise, so too do the heat-related deaths.
These findings add perspective and context to a growing body of research illustrating how neighborhoods with less green space and tree canopy are hotter on average than their greener counterparts, and that this disparity neatly correlates with the racial and socioeconomic make-up of neighborhoods.
These relationships are neatly illustrated in a city like Philadelphia, PA. In 2019, the city’s Office of Sustainability, in collaboration with the Public Health Department, developed an open access Heat Vulnerability Index documenting land temperatures across neighborhoods to properly ascertain the neighborhoods, or “hot spots”, most at risk from extreme heat events. This map not only demarcates priority areas in which the city can concentrate its heat mitigation efforts, but provides a tool for public outreach and engagement: residents can access this map to learn more about their neighborhood, and how it compares with others in the city. The city found a 22°F difference between the lowest risk and the highest risk neighborhoods.
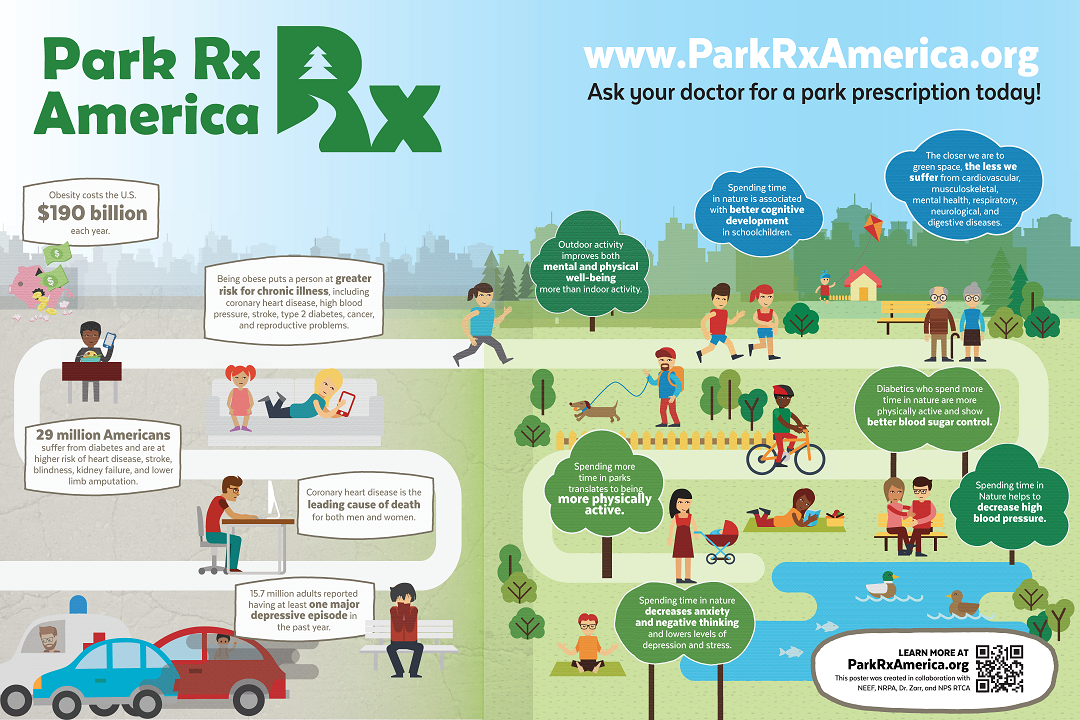
In a correlating health impact assessment of Philadelphia’s tree canopy goals published earlier this year, the researchers argue that urban tree-planted green spaces should be regarded as a substantive public health and cost-saving measure. In addition to improving mental health, and increasing opportunities for social interactions, community cohesion, and physical activity, while reducing stress, crime, and violence, greenspace “can also (a)ffect mortality, itself.” Study findings conclude that, every year, if the city were able to meet its goal of a 30% citywide tree canopy cover, an estimated 403 premature deaths could be prevented, saving Philadelphia an associatedpredicted value of nearly $3.9 billion. More than half (244) of these premature deaths occur in low-income neighborhoods of color.
Meanwhile, on the other side of the country, the Los Angeles Urban Cooling Collaborative (LAUCC) – a multi-disciplinary alliance of researchers and practitioners – is modeling urban cooling strategies, or “prescriptions” that could reduce extreme temperatures and heat-related mortality. They collected data during four summer heat waves that occurred between 2006 and 2010; analyzing the different characteristics and even timing of these heat events. The effects of humidity, especially, are of interest to researchers. Humidity exacerbates even moderate heat events because it interferes with our bodies’ main internal cooling mechanism: when the air is already too laden with moisture, the evaporation of sweat slows down. If one can no longer sweat, the body’s core heats up beyond its narrow survivable range, and organs begin to fail.
According to LAUCC’s calculations, shade trees can lower surface temperatures by as much as 45°F. In terms of air temperatures, trees can cool the surrounding air by as much as 9°F by way of evapotranspiration. They found that the implementation of the boldest prescription – a combination of high tree canopy and surfaces with high solar reflectance – translated to dozens of saved lives even during the most severe heat waves.
For example, during the heat wave of September 2010 alone, there were 74 heat-related mortalities in LA County. By swapping out treeless concrete streets with shady vistas and white roofs, 22 out of the 74 would have survived — a 29% reduction in mortality. Again, most of these saved lives were would have been from low-income communities of color.
Because humans can only thrive in a narrow range of temperatures, even a change of a couple of degrees in either direction can have vast consequences for human health. While local heat mapping and modeling efforts have demonstrated that merely providing more shade can significantly reduce heat-related mortality, larger-scope climate models predict an increase in the frequency, severity, and duration of heat waves in coming decades. In other words, extremely hot days will become much more common.
Heat disparity research in the Chesapeake Bay Watershed
Some of the first cities to map their hot spots and assess heat disparities are right here in the Chesapeake Bay watershed. In Richmond, VA, a NOAA-funded campaign enabled Dr. Jeremy Hoffman and Dr. Eugene Maurakis of the Science Museum of Virginia to recruit citizen-scientists from several local schools and grassroots organizations. On a hot day in July of 2017, these volunteers traversed through the city in cars and on bikes equipped with devices designed to mark location, air temperature and time. The data were then fed into a software package developed by Portland State University professor Vivek Shandas (who is also co-author of the above-mentioned article on redlining) and his team.
The results showed differences of up to 16°F across neighborhoods during the hottest part of the day. Mapping the data also helps researchers correlate ambient air temperatures with other data, such as tree canopy coverage, income levels and amounts of impervious cover, thus providing a clearer picture of the areas of the city most at risk, and why.
“It was really this community-powered campaign that started it all,” says Hoffman, “Our nonprofit partners helped connect the dots between their lived experiences and the data we were sharing with them. It has put our City on the trajectory toward shade equity.”
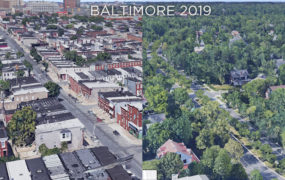
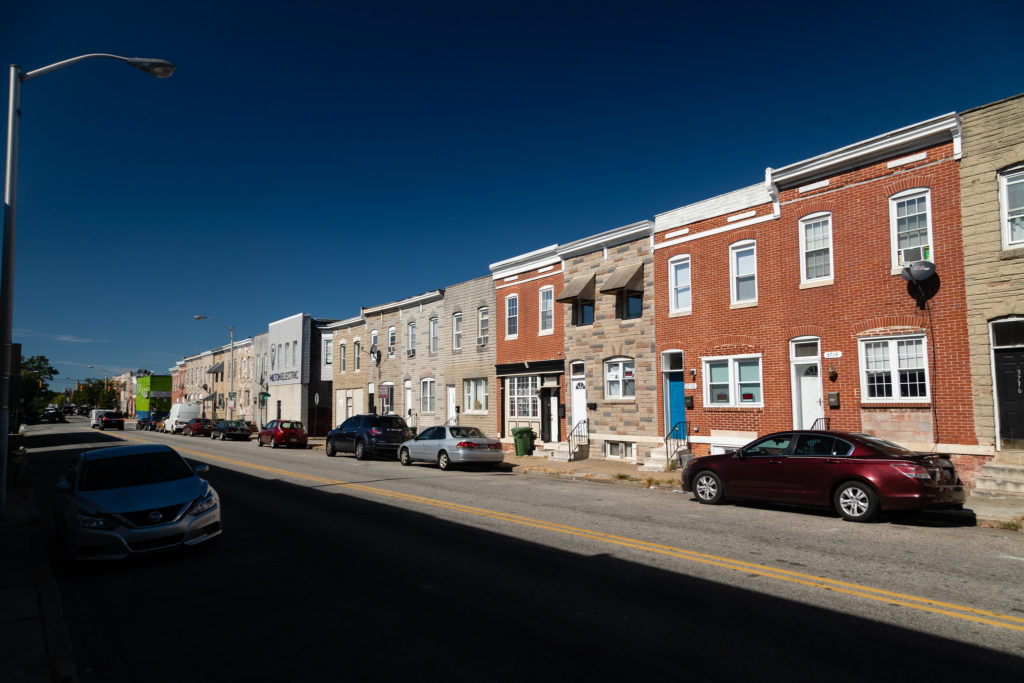
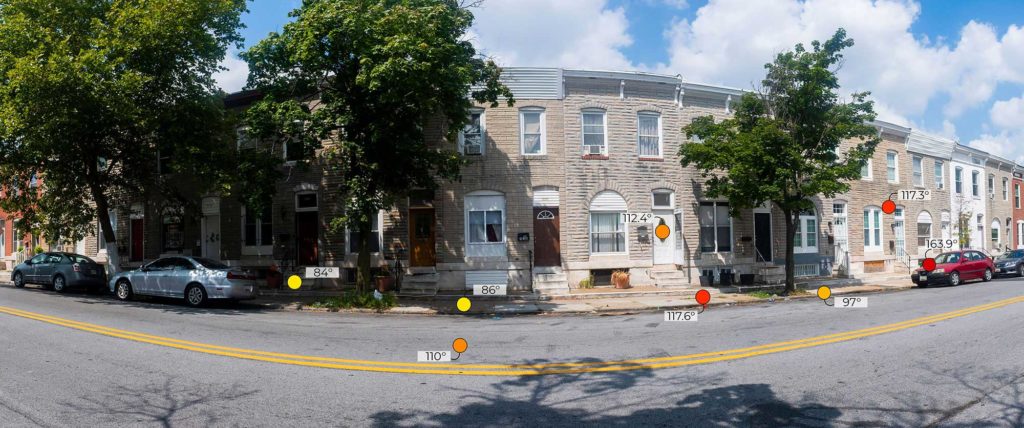
In Baltimore, MD, average annual temperatures over the last hundred years have increased at nearly twice the rate as the rest of country. Researchers now estimate the number of dangerously hot days – or “Code Red” days – could increase six-fold by 2050. In the summer of 2019, reporters from the University of Maryland’s Howard Center for Investigative Journalism and Capital News Service placed heat sensors inside several homes in Baltimore’s poorest neighborhoods, which recorded temperatures as high as 97°F and a heat index of 119 °F. In some instances, cooler temperatures were recorded outside of the homes. Twelve Code Red days were declared by the health department by the beginning of August.
In temperature readings taken by researchers at Portland State University in Oregon and the Science Museum of Virginia on one particularly hot day in August 2018, there was an 16°F difference between the coolest neighborhood in the city, which has 40% tree canopy coverage, and the hottest neighborhoods in the city, which has a tree canopy coverage of only 10%.
Reducing the impact of urban heat islands
Urban heat islands and their effects are now, without any doubt, an equity issue, and cities working to mitigate its effects must concentrate their efforts in low-income communities of color, which have borne the brunt of not only increased exposure from living in deserts made of asphalt, concrete and metal, but also historic disinvestment in public amenities, like trees and greenspace, that have proven to reduce and mitigate myriad urban stressors. Across every major US city, the same patterns have been established: people who live in the hottest and least canopied parts of the city are more likely to be poor, experience higher rates of unemployment and violent crime, and struggle with higher rates of chronic illnesses.
Increased availability and accessibility of public cooling centers, unfortunately, is not a long term solution, as the duration of heat waves can go on for weeks on end, and many have to walk through 100°F weather in order to get to one. Exponential increases in energy use associated with air conditioning only further exacerbate the greenhouse effect, driving climate change even more.
The combination of increased tree cover and reflective surfaces remain the most effective measures to counter this downward spiral and must be viewed as pivotal infrastructure investments – requirements for the health and wellbeing of all neighborhoods.
Looking at the certainty of more extreme heat events begs the question of how else cities and governments can integrate such threats into their emergency planning repertoires. “Can we name heat waves like we name hurricanes, and even have them recognized as the natural disasters they are by Federal Emergency Management Association and other planning agencies?” asks Shandas. “Issues of diversity, equity and inclusion are still left out of conversations around mitigation planning on the national level, but these are disasters that we can plan for.”