An urban tree canopy (UTC) change analysis is an important tool for helping communities monitor changes in tree cover and track progress toward achieving canopy goals. A recent UTC change analysis of Baltimore, Maryland, showed that tree cover in the city increased from 27 to 28 percent over an eight-year period. Along with this exciting discovery, the analysis led to valuable insights on the nature of the gains and losses in Baltimore’s tree canopy.
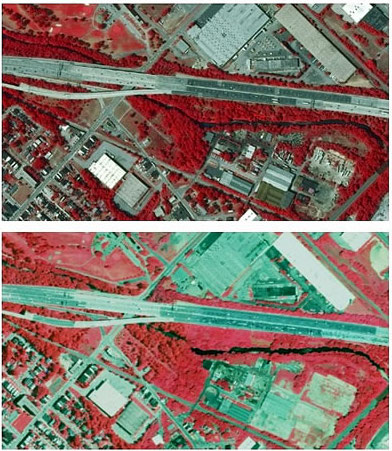
The Baltimore UTC change analysis was completed by the University of Vermont’s Spatial Analysis Laboratory, in collaboration with researchers from the U.S. Forest Service and the City of Baltimore. Using high-resolution aerial imagery and 3D airborne LiDAR data, the researchers calculated a 1% net gain in tree cover in Baltimore from 2007 to 2015. This finding is significant because most cities in the U.S. experienced a decrease in canopy cover within the same time period.
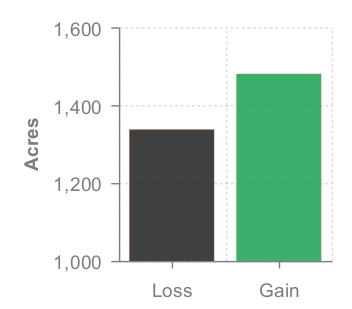
In addition to calculating changes in canopy cover, UTC change analyses provide rich information that help cities understand the patterns, processes, and mechanisms behind the percent change in canopy cover. A closer look at the changes on Baltimore’s landscape indicated that there were large gains in some parts of the city as well as large losses in tree cover in other parts of the city between 2007 and 2015. Most of the losses occurred as rapid events, due to storms, the impact of pests, or the removal of trees for new development. In contrast, increases in canopy occurred more gradually because of the slower processes of plantings and tree growth.
Therefore, one of the biggest takeaways from the Baltimore UTC change analysis is that canopy change is more than a net change in canopy cover; it is a question of how much the city conserves, gains, and loses – and where, why, and how those events take place. While an emphasis on increasing tree canopy cover is critical to achieving Baltimore’s 40% canopy goal, prevention of loss is also critical. Baltimore saw an overall increase in tree cover, yet over 1,300 acres of trees were removed from 2007 to 2015. To continue to support a growing tree canopy, the city must work on preventing the loss of trees in the future. Coordination and awareness-building across city government can help, as can outreach to private and institutional landowners.
A second important takeaway is that tree canopy loss and its impact on ecosystem services is dependent on canopy type. For instance, the change analysis showed substantial losses of forest patches on private residential lands between 2007 and 2015. Urban forest patches are particularly effective at filtering stormwater, serving as habitat for wildlife, and providing recreational opportunities to local residents.
On the other hand, increases in Baltimore’s street trees during this time associate with different ecosystem services such as reducing urban heat and crime, and boosting property values. These results suggest that even though Baltimore saw a small increase in tree cover, a decrease in forest patches and gain in street trees resulted in substantial changes to the local suite of ecosystem services provided by urban trees.
According to Morgan Grove (U.S. Forest Service), the Baltimore’s UTC change analysis captures how a break down in communication among the players responsible for managing Baltimore’s urban forest can discernibly influence canopy gain and loss. Baltimore City agencies such as the Department of Recreation and Parks are responsible for planting trees, but other city agencies and players may be working at cross-purposes to approve tree removals. Improved communication among players could help the city more effectively promote its urban tree canopy both through protection and planting.
Conducting a UTC change analysis may sound relatively straightforward. However, team members of the Baltimore project caution that there is a lot more to it. “Mapping change over time over time is more than simply mapping tree canopy at two points in time,” said Jarlath O’Neil-Dunne (University of Vermont/USDA Forest Service). The source data used to map tree canopy from two points in time rarely align perfectly, making it easy to make the mistake of mapping change that is due to shifts in the data rather than actual gains and losses in tree canopy. In Baltimore, as in other areas where the Forest Service team has carried out this type of work, the team mapped change at the individual tree level rather than carrying out separate mapping activities for each date. This process minimized the issues associated with the source data and maximized the ability to quantify change over time. For jurisdictions looking to do a UTC change analysis, it is key to keep this in mind. Using two maps created from different methodologies or types of datasets can easily lead to inaccurate results.
Yet a carefully conducted UTC change analysis is a powerful tool that not only allows communities to assess canopy change, but also get a fine-scale understanding of where gains and losses are occurring and the drivers of change. This analysis for Baltimore resulted in findings that will help the city adaptively manage and improve their restoration efforts. The city has been successful in expanding tree cover so far, but there are a number of things that can be done, including increased protection of forest patches and better coordination among the players that manage tree canopy.
If you’re interested in exploring the Baltimore data more, the City of Baltimore created an on-line interface for mapping where change occurred.
Homepage Slider Photo courtesy of TreeBaltimore and Matter
Story written by Tuana Phillips